These Interactive MotoGP Charts Will Get You Familiar With The Series
If you're new to the sport or just need a refresher, this is a great place to start.
There are two things I love in this world: Motorsport and beautifully laid out data spreads. These interactive charts from McGear Hub that illustrate the history of MotoGP perfectly encapsulate both of those passions.
Seriously — if you're a two-wheeled beginner, this is a great place to start. McGear Hub starts out with a brief written history of motorcycle racing, which can be super helpful if you, like me, just kind of unceremoniously popped into the MotoGP world and decided you'd figure things out as went along. It also provides a handy bit of context to interpret the data spreads should you so desire.
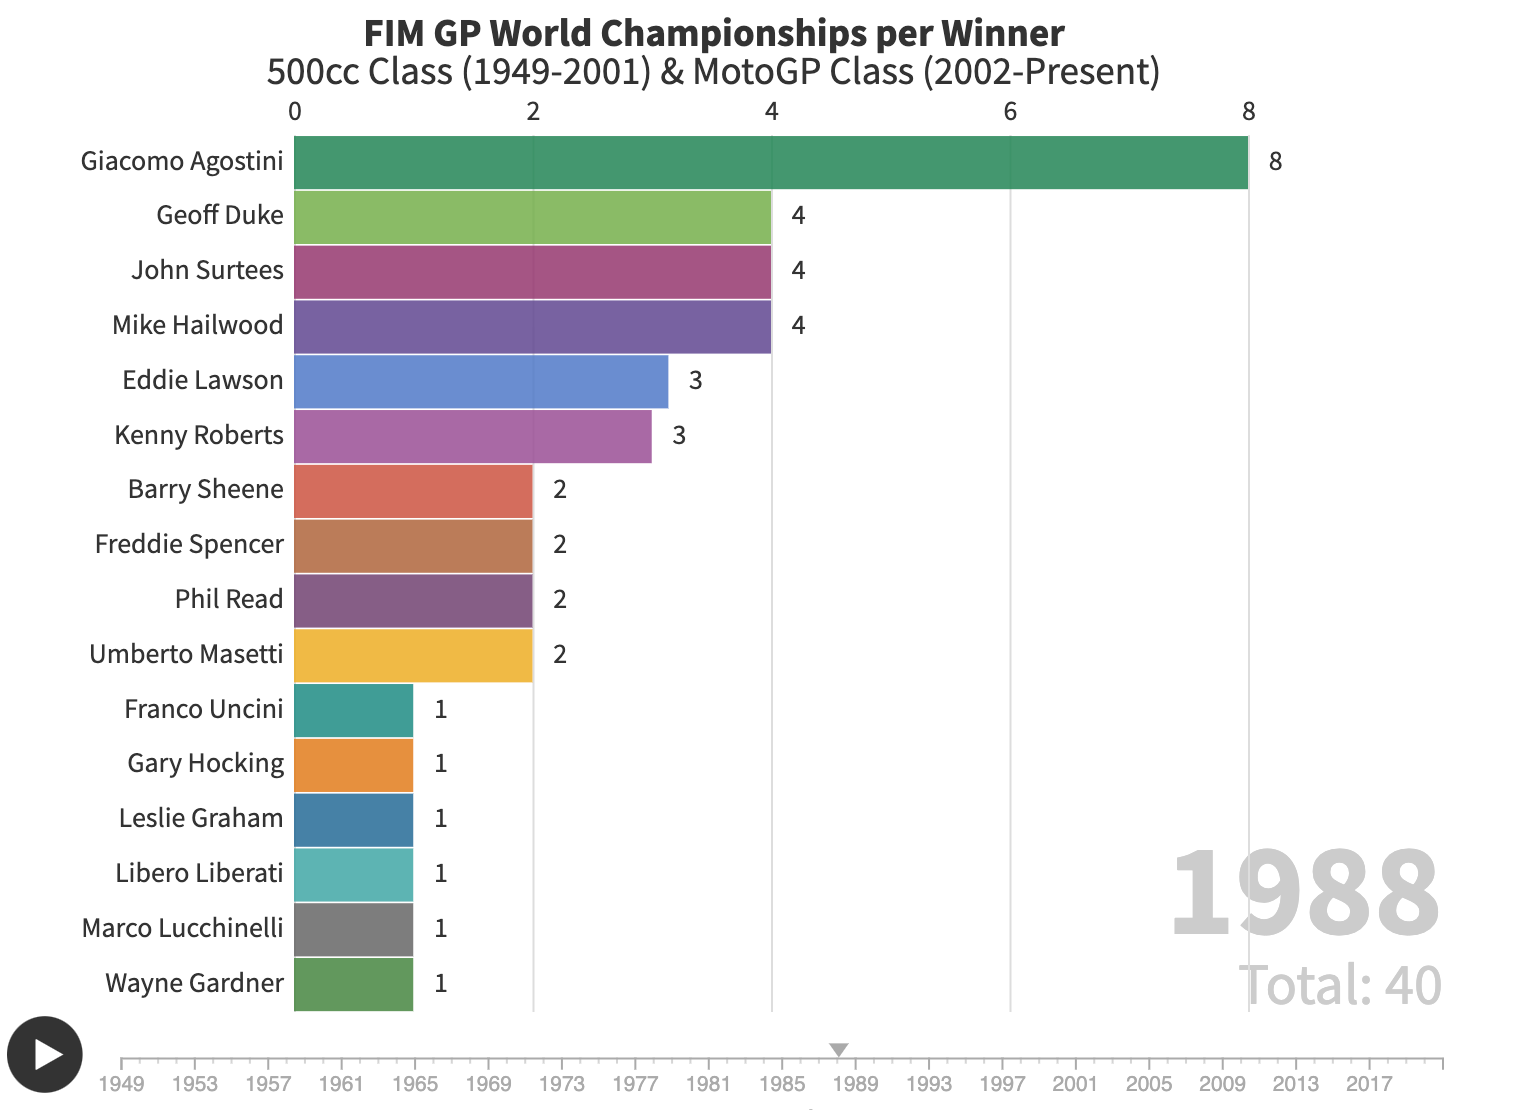
And then we move onto the charts, which show the year-by-year evolution of MotoGP. You can explore the number of World Championships that each winner accumulated:
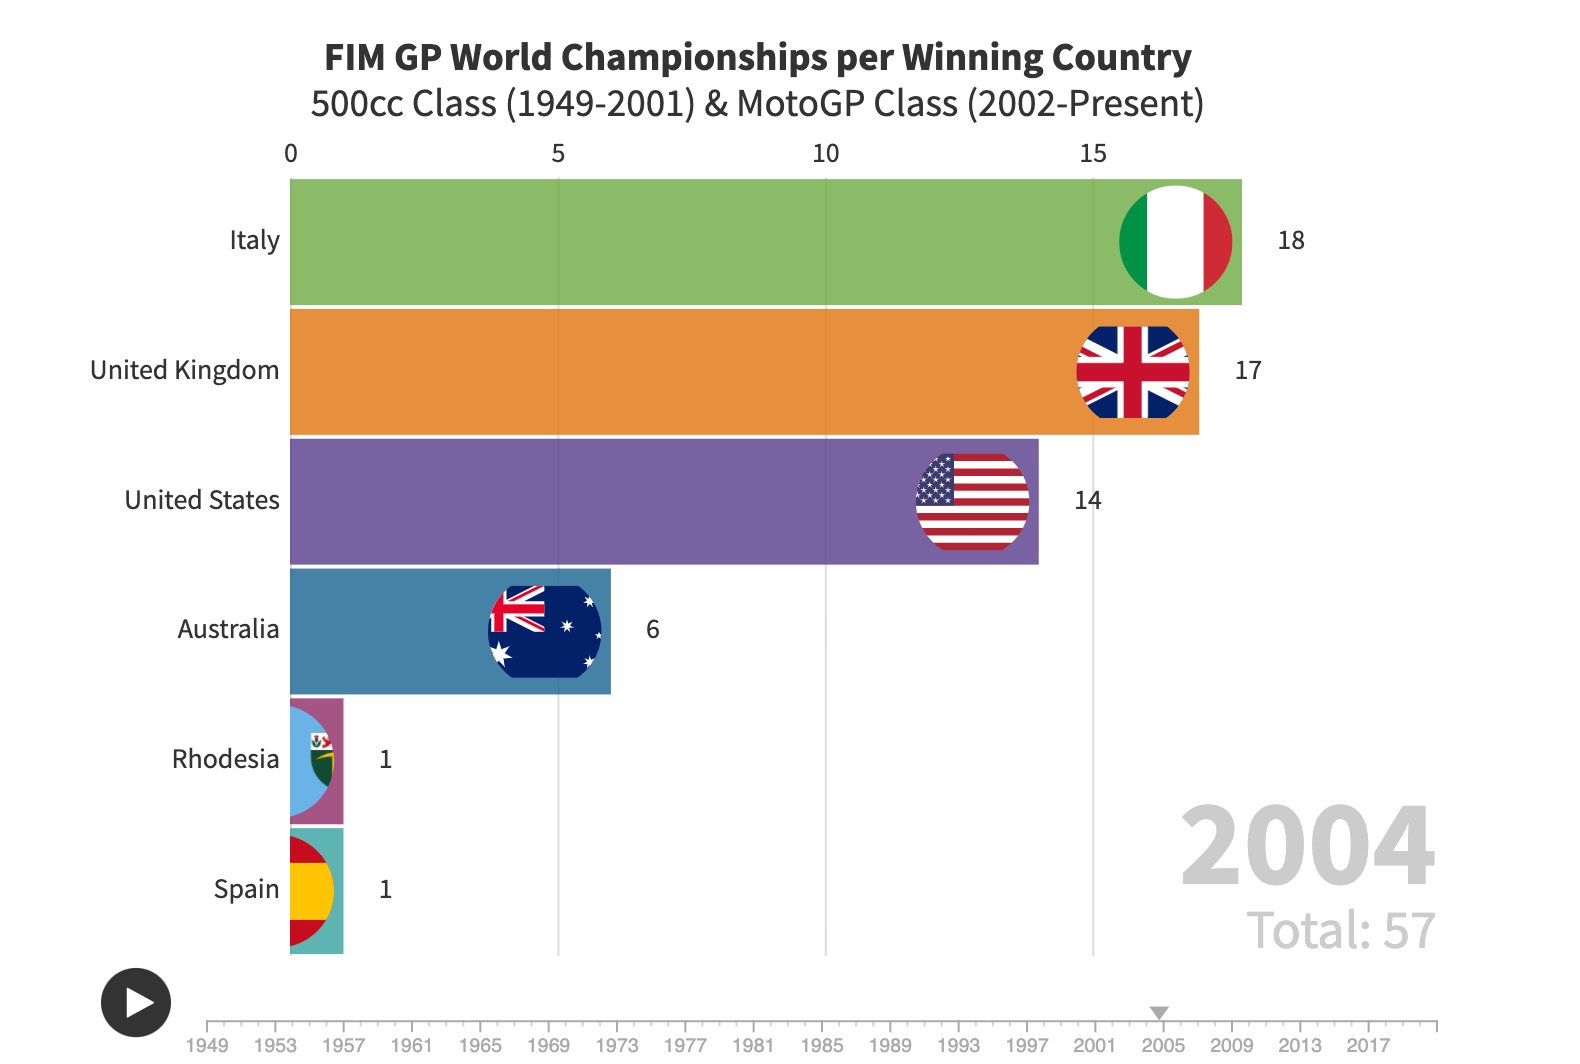
You can also check out other graphics, like the number of Championships earned per country — which shows exactly when Italy overtook the United Kingdom in terms of domination of the 500cc (or top-level MotoGP) class:
There's also an exceptional graphic that shows the number of Championships earned per rider since MotoGP took on that nomenclature; for several long seconds, all you can see is Valentino Rossi's face thanks to his domination of the sport.
And again, if you need more context, there's plenty of written information to help you get the hang of what you've read. You can also click on a specific year within the graphics to maneuver back to a certain time period.
If you're not a fan of the moving graphics, there are also still graphics that lay out the most recent bits of information. You can also pause the moving graphics at any time to understand a little bit about, say, what the history of the championship looked like in a certain year.
Now excuse me while I go finish MotoGP Unlimited.