How Fuel Economy Is Measured (And Why You Get Different MPGs)
Ever wonder who comes up with those fuel economy numbers?
Ever wonder who comes up with those fuel economy numbers? Does the Environmental Protection Agency do it in some secret underground lair, or is it some guy named Billy Bob in a barn somewhere in Kansas? How do they come up with those numbers, anyhow? Let's talk through the basic science.
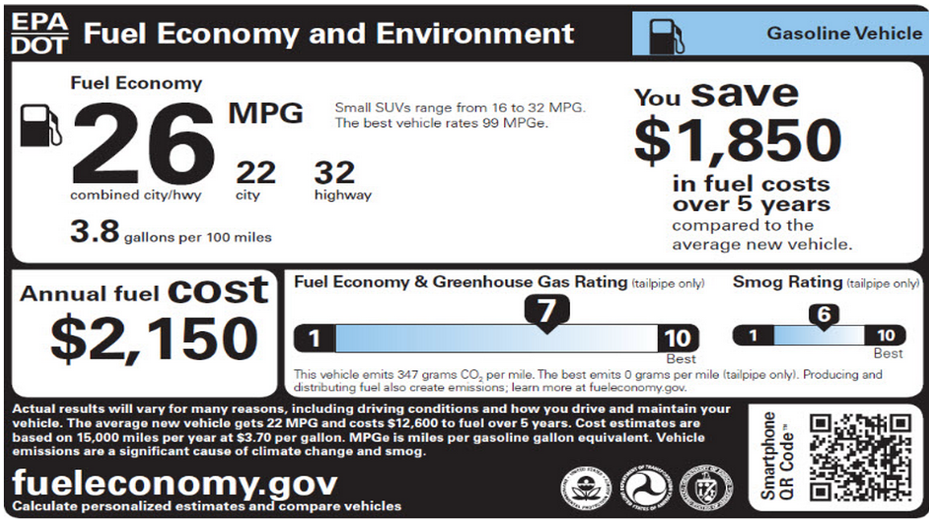
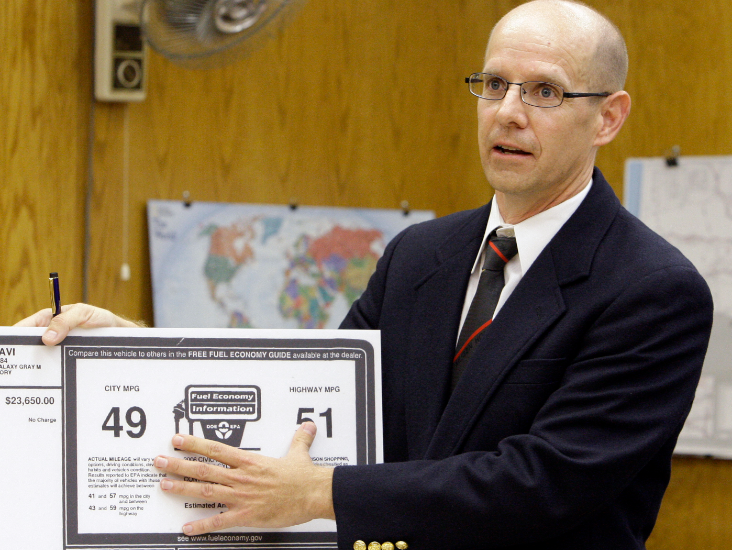
Fuel economy is everything these days. Automakers are jumping through hoops to eke out every last tenth of a mile per gallon to meet both regulatory and consumer demands, so this stuff is important. The most important fuel economy numbers, though, are the ones on the "label," also called the Monroney Sticker. Let's talk about where these numbers come from.
Who Measures Fuel Economy?
First things first: automakers measure their own fuel economy. The EPA says it audits about 10-15 percent of vehicles at their facility in Ann Arbor, but it's really up to the manufacturers to provide accurate fuel economy data. The EPA simply doesn't have the resources to test all vehicles.
While the EPA may not have the means to test all cars, it has no trouble cranking out tons of complex fuel economy test methods and regulations. The EPA provides all of this to manufacturers so that they know exactly how to measure fuel economy. Car companies have entire departments devoted to interpreting these test procedures, because getting this wrong can cost you hugely.
How Is Fuel Economy Measured?
So, do car companies calculate fuel economy by just driving the car on a track a few times, and measuring the mass of fuel before and after? Nope. That's not a controlled environment, so results wouldn't be repeatable. Instead, manufacturers run all fuel economy tests on chassis dynamometers, basically indoor rolling roads that apply loads on a vehicle's wheels to simulate real-world driving (almost like treadmills). The prescribed fuel economy cycles are run (more on drive cycles later), and fuel usage is measured by plugging hoses onto cars' exhaust pipes. The chemical makeup of the exhaust is used to determine precisely how much fuel is burned during the drive cycle.
So, now we know that automakers determine their own fuel economy on dynos, but how exactly do they come up with that magical MPG figure?
EPA Drive Cycles
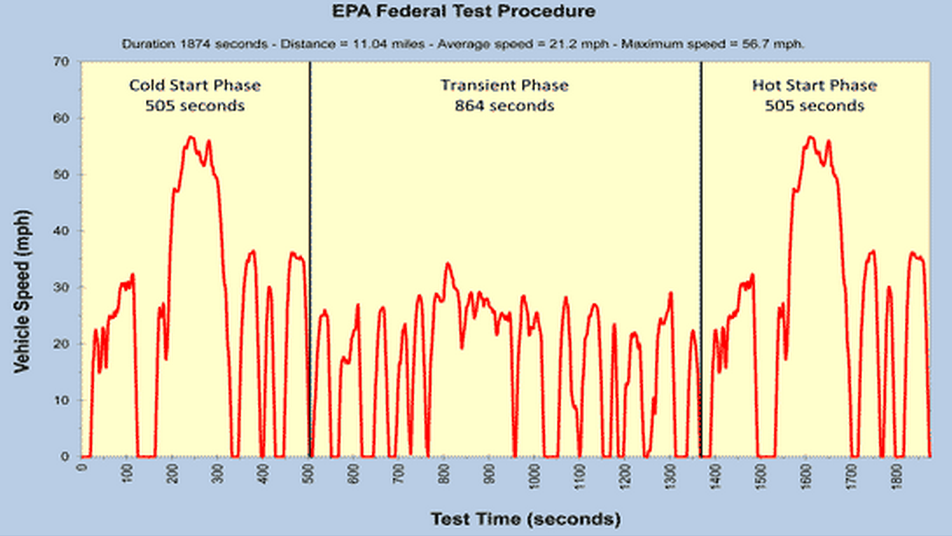
Let's start by talking about Drive Cycles. Also called "Schedules," or "Driving Routines," EPA Drive Cycles are simply designated speed traces (vehicle speed vs time) that all certified vehicles must follow during fuel economy testing. The speed trace shown below is the EPA's city test, called the FTP City cycle. This test procedure, around since the '70s, is meant to simulate a transient, traffic-intense driving condition. Basically, stop-and-go city traffic.
Then there is the Highway Fuel Economy Test Schedule (HFET). With an average speed of about 50 mph, it is meant to represent steady flowing highway driving. Together, the city and highway cycles used to be the only two EPA drive cycles considered when determining "label" fuel economy. It's pretty obvious that the highway cycle is quite mild, and if you look at the maximum acceleration during the city cycle in the table below, it becomes apparent that it, too, is not exactly aggressive.
(It's important to note that the procedure you're reading about is the U.S. fuel economy test — the Europeans measure theirs differently, which is why their MPG ratings seem ridiculously higher than ours for the same vehicles. But that's a story for another day.)
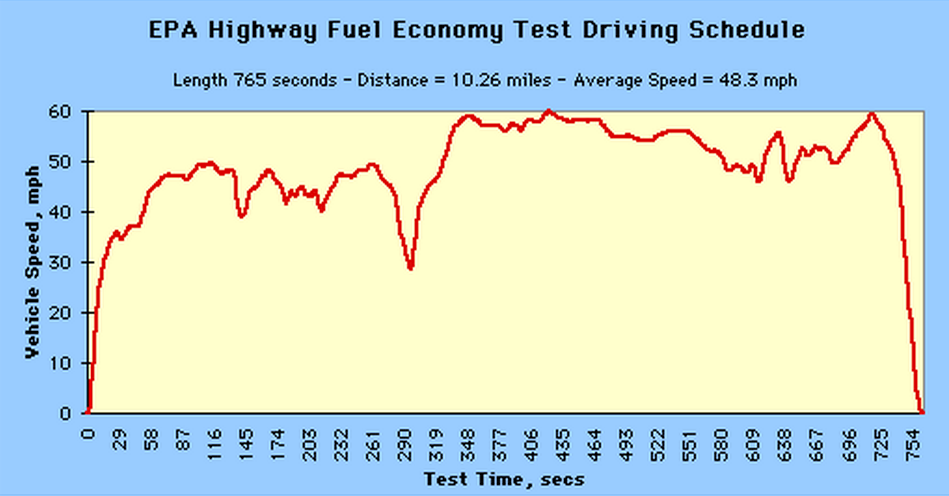
The EPA decided to switch it up in 2008, implementing three additional test procedures to ensure that "label" fuel economy came much closer to the fuel economy customers saw in the real world. These supplemental tests, US06, SC03, and Cold FTP, account for the effects of higher highway speeds and accelerations seen on modern roads, air conditioning use, and cold ambient temperature, respectively. I've pasted the technical info on all five tests below, but you can have a look at the speed traces for all five drive cycles on the EPA's website.
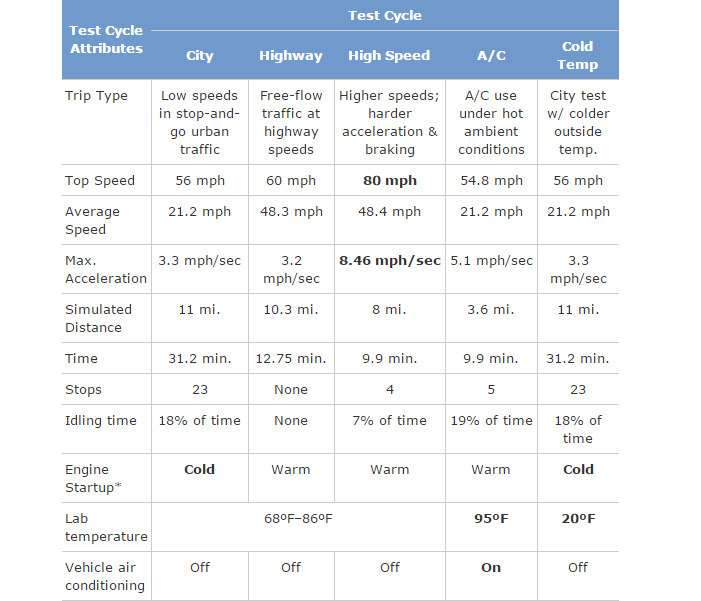
So, all in all, there are five total drive cycles used to measure "label" fuel economy. The EPA has a complex formula that uses the results from these five tests, adjusts them to account for wind, tire pressure, fuel, and road surface variations, and comes up with final city and highway fuel economy values that end up on your window sticker. Oh, and that Combined MPG number? That's simply a weighted average that considers 55% city driving and 45% highway driving. Put in equation form for you nerds:

So do automakers have to run all five cycles on all vehicle variations? The short answer is "no." In some cases, they can get away with just running the FTP City and Highway tests. The output from those are adjusted and MPG is determined in what's called the "Derived Fuel Economy" method. There are certain stipulations that must be met for automakers to get away with not having to run all five tests, but I won't delve into those. And automakers don't have to run every vehicle configuration. The EPA has guidelines that tell automakers how to choose which vehicle configuration and subconfiguration to certify. It's basically based on vehicle weight and expected sales volumes.
Fuel Economy Testing
So, automakers run the EPA's prescribed test schedules on dynos, but how do they generate the actual fuel economy data? The dynos are basically a set of rollers that sit beneath the driven wheels. Their job is simple: add load. Think of a dyno as an exercise bike. If you crank up the resistance, it takes more energy to maintain the same speed. So figuring out how much load to add, as you can imagine, has a huge effect on fuel economy.
A car just sitting on a dyno and spinning its driven wheels will get much better fuel economy than it would in the real world running the same drive cycle. That's because the drag from the undriven wheels and the associated drivetrain isn't considered on the dyno. Aerodynamic forces are also not accounted for. So, how do automakers adjust the dyno to capture the loads the car would actually see on the road? The answer lies in Coast Down testing.

Let's talk about the loads acting on a car as it drives down a smooth road. Predominant forces resisting a vehicle's forward motion are: aerodynamic drag, bearing drag, brake drag, gear drag, and tire rolling resistance. The fuel economy tests run on the dynos need to represent these forces accurately. If the dyno overloads the vehicle, the car will perform poorly. Too little load on the vehicle, and fuel economy numbers will be inflated.
The solution is to run "Coast Down" tests. The test, standardized by the Society of Automotive Engineers, is simple: automakers drive their car on a road at 80 mph, drop the car into neutral, and measure its velocity vs. time. From there, they can use the car's mass to determine the force resisting forward motion, F, on a car as a function vehicle speed. The equation takes the following form:

This is a second order polynomial, which makes sense, since aerodynamic drag varies with velocity squared. The coefficients in this equation are called "Coast Down Coefficients" or "ABC Coefficients." An easy way to understand this formula is to think of the C term as representing aero drag, while the B and A term roughly represent drivetrain losses and rolling resistance, respectively.
Certain forces, like bearing and brake drag on the driven wheels will exist even on the dyno, so there's no need for the dyno to impart that load again onto the vehicle during testing. So automakers run another coast down test, this time on the dyno, and use that data to subtract out certain factors. At the end of the day, automakers end up with a set of refined coast down coefficients (these are publicly available on the EPA's website), which they use on their dynamometers to simulate true, real-world driving conditions. They run the EPA's speed traces, measure the chemical makeup of the exhaust to determine fuel burned, run a few calculations, and out comes a shiny new fuel economy value.
What You’re Getting
All of this matters because you, the consumer, have been duped time and time again on fuel economy numbers. Your sticker says 40 MPG, and you're getting a measly 32. Unacceptable. Hyundai's big goof-up was that they inaccurately measured road load, so the ABC coefficients they used to adjust their dyno were far too generous. The dyno did not impart enough load on the car, and fuel economy was inflated. But what are other reasons why you might not be getting advertised fuel economy?
The EPA knows its tests aren't perfect. Heck, they have a web page entitled "Your Mileage May Vary," so you bet they've heard an earful from consumers. On their aptly named web page, the EPA describes other factors that can cause your MPGs to drop below sticker values. They talk about driving style, vehicle condition, variations in fuel, and engine break-in. All good points. Bad fuel, crazy driver, new engine equals low MPGs. A bad wheel bearing or dragging brake means higher road loads and low MPGs. Ambient conditions also affect fuel economy. If it's cold outside, your engine will idle higher, viscous losses will increase, and certain fuel economy functions may be disabled. This all means you'll be buying more gas.
Another variable is vehicle configuration. If you opted for the big wheels and the 4.10 axle ratio, that'll cost you, because the car was probably labeled with the smaller wheels and taller axle ratio. These are just a few of very many reasons why you might observe lower fuel economy than what you see on the sticker. Things get even more complex if you own a hybrid, as they're particularly sensitive to temperature variation, and their test methodology differs markedly from conventional vehicles.
Hopefully knowing how fuel economy is actually tested will help you, the consumer, understand the lengths automakers have to go to put those two big numbers on your window sticker.
Photo Credit: Associated Press, The EPA
Geeking Out is former Fiat Chrysler engineer and current Jalop scribe David Tracy's weekly missive on all things intensely technical about cars. He can be reached at at david.tracy@jalopnik.com.
