America's 'Most Dangerous Car' Is Actually Pretty Damn Safe
The automotive research firm iSeeCars.com released a study called "The Most Dangerous Cars in the U.S." and as a result, a bunch of websites have been running articles with titles like Fatal Attraction: These Are The Deadliest Cars On The Road, which certainly has some nice life-or-death drama to it. Here's the thing, though: when you really dig into the numbers and methodology used to get the results, it turns out that America's "most dangerous" car really isn't all that dangerous, when you put it in perspective.
I'll cut the tension for you and just tell you right now that the study found the sad little Mitsubishi Mirage to be the deadliest car in its results, as though the poor Mirage really needed something else for people to razz it about.
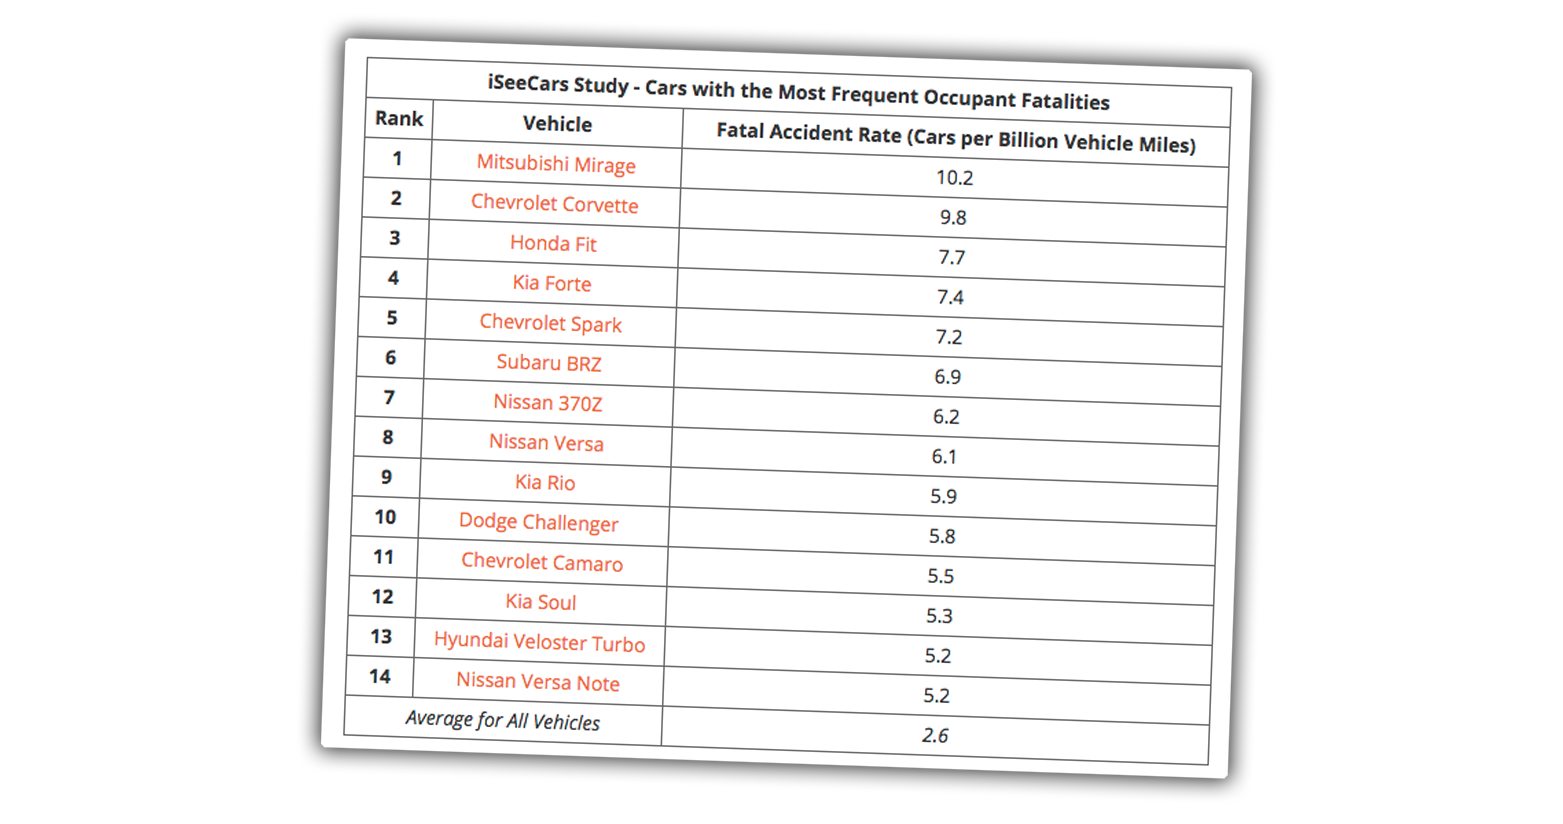
Here's the study's list of the 14 cars with the most frequent occupant fatalities:

OK, so, let's take a moment here and really think about what these numbers actually mean, because it's not that obvious.
Here's how iSeeCars described how they did the study:
iSeeCars.com analyzed fatality data of model year 2013-2017 cars from the U.S. Fatality Analysis Reporting System (FARS) and more than 25 million used cars from the same model years to determine the vehicles that are most often involved in fatal accidents. It found that there are 14 models that are at least two times as likely as the average vehicle to be involved in a fatal accident.
That means we're dealing with cars from 2013 to 2017, and, according to the chart, we're looking at fatal wrecks per one billion miles. That's a big number. How did they come up with that number of miles?
There's actually kind of a lot to figure out here, so I enlisted the help of David Tracy, who's much better at math and actually, perversely, seems to enjoy figuring stuff like this out.
I want to look at the worst car on their list, the Mirage, and really understand just how unsafe it actually is, in more objective terms. Basically, we want to know how much of a risk are you putting yourself in every time you get into a Mitsubishi Mirage.
David Dives In:
I reached out to the author of the study, Julie Blackley, and she and the data scientist described the methodology. It was a little difficult to understand, but here's what I gathered:
First, the team determined via NHSTA's Fatality Analysis Reporting System how many fatal crashes occurred between 2012 and 2017 involving 2013 to 2017 model years of a certain model.
Then iSeeCars went through its vast database of cars sold in 2017 and averaged the number of miles each model year of a certain car had on it. So all 2014 Mirages, for example, might have had an average of 50,000 miles on them in 2017. All 2015s might have had an average of 40k in 2017, etc.
Once they knew how many miles, on average, each model year of a certain model had by 2017, the team had to determine how many of each model year of that certain model was on the road traveling all those miles. The team did this by first looking up the average number of cars on the road during each calendar year between 2013 and 2017 (this is a number published by some organization—we're not sure which).
Then the team figured out what share of each year's total vehicle population each model year of a certain model year represented. To do this, iSeeCars used its database of 25 million car sales, and divided the number of each model year of a certain model sold during each calendar year between 2013 and 2017 by the total number of cars sold in that calendar year.
So if 5,000 2014 Mitsubishi Mirages were sold in 2015 and 1,000,000 cars were sold that year, then 2014 Mirages represented .005 of the full population of cars on the road in 2015. iSeeCars did this calculation for the 2014 Mirage for all relevant calendar years between 2013 and 2017, and averaged the figures over the calendar years to get an average share of all cars on the road that 2014 Mirages represented between those years.
Then the team multiplied that average share by the average number of cars on the road between 2013 and 2017 (again, the average number of cars during each year is apparently a published figure), ultimately determining, on average, how many of each model year Mirage was on the road during that span.
The team then multiplied this figure by the average number of miles each model year traveled by 2017 (again, this is based on sales figures in 2017), and added all the model year totals all up to get the total Mirage miles traveled between 2013 and 2017.
In the case of the Mirage, it was around 2 billion miles traveled and, according to iSeeCars, 20 were involved in fatal crashes.
So 20 fatal crashes over 2 billion miles equals about 10 fatal crashes per billion vehicle miles traveled.
Blackley wanted to clarify one point:
Just to make sure we're on the same page, for each model year, the average mileage was obtained from data in calendar year 2017. However the share of sales was taken for each model year over calendar years 2013 – 2017, so something more like an average share across the five years.
We had another question, though: we want to know just what sort of risk of a fatal crash someone has when they get into a Mirage. To figure this out, we'll assume that the average Mirage owner drives their car 15,000 miles per year (that's the annual mileage the EPA assumes when it writes its annual Fuel Economy Guides) which means we can say the chance of them being involved in a fatal crash in their Mirage during a given year of driving would be, roughly, 15,000 miles divided by one billion miles times the number of fatal crashes per billion miles, (10.2), giving a result of 0.0153 percent chance you'll be in a fatal crash in your Mirage.
We asked the study's author if she felt this was reasonably accurate, and she responded:
I think what you're calculating is the expected number of crashes per year for an average car, which is a rate rather than a probability of a crash. But if I'm calculating it correctly, for small numbers, the rate is a reasonable approximation of the probability of a crash. The actual chances of being in a crash likely vary greatly with driver/experience, road, weather, condition of car, etc.
Those are all very valid hedges. We're not really factoring in anything like road conditions or weather or driver skill, we're just looking at overall numbers. But, she agreed that's a reasonable approximation of how likely you are to get killed in a crash in your Mirage: 0.0153 percent.
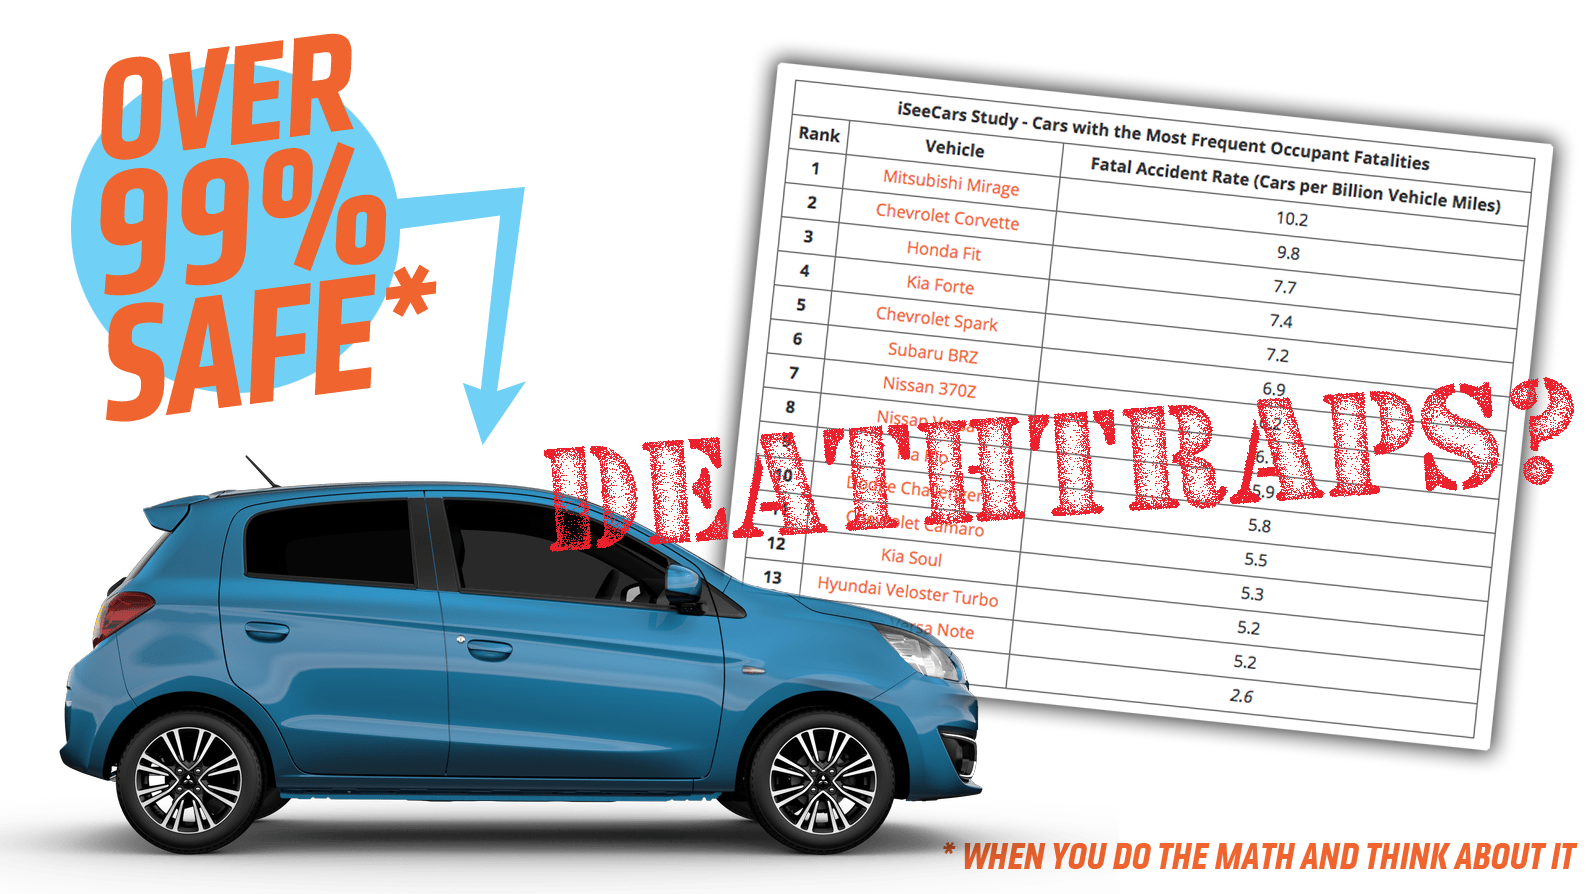
So, with that in mind, that should mean we can say that the car this study said was the "Most Dangerous" car in America, the Mitsubishi Mirage, is a car that is 99.985 percent safe.
I'm not sure anything I do on a regular basis is as safe as that.
So, we have to acknowledge that figure is far from exact and relies on a bunch of assumptions, but my real point is this: When you're seeing all these articles breaking down the "deadliest cars on the road" and these important studies showing just how deadly some of these small cars and sports cars are, it's worth taking a moment to think about these things in context.
Yes, it does seem the Mirage has more fatal crashes per billion miles than other cars on the road. That seems to be true. But, it's also worth looking at the big picture here and seeing that overall, this most dangerous car really isn't that dangerous at all. Though, almost every other car out there is even less dangerous, which is also worth remembering.
To be fair, though, even if we look at the usual IIHS crash tests and ratings, the Mirage actually fares pretty damn well, especially considering its small size.
Every one of my old shitbox daily drivers is orders of magnitudes less safe than this Mirage, no question. Modern cars really are incredible when it comes to safety, and if you have a 99.9 percent chance of not dying in a Mirage, then I'd say that's a pretty wonderful thing.
I'm not saying don't buy the safest car you can get, if that's what you want, but we will say that if studies like these make you think cars like the Mirage or BRZ or Honda Fit are deathtraps, you're dead wrong.
